

Kubernetes Horizontal Pod Autoscaler (HPA): CPU, Memory and Custom Metrics
What the HPA does #
The Horizontal Pod Autoscaler (HPA) changes the replicas of a Deployment, StatefulSet or ReplicaSet according to a metric, usually CPU. More load, more pods; less load, fewer. It scales out (more pods). Making a pod bigger is vertical scaling (the Vertical Pod Autoscaler). Adding nodes for the new pods is the job of a cluster autoscaler such as Cluster Autoscaler or Karpenter on EKS.
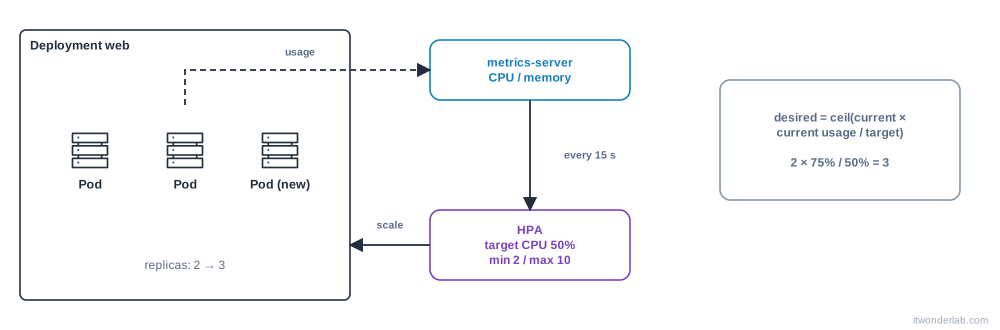
The formula, evaluated every 15 seconds by default:
desiredReplicas = ceil( currentReplicas × currentMetric / targetMetric )With 2 pods at 75% CPU and a target of 50%: ceil(2 × 75 / 50) = 3. The HPA ignores changes under a 10% tolerance and applies stabilization windows so it does not flap.
Requirements #
- metrics-server running, which provides
kubectl topand the resource metrics API. K3s, Rancher Desktop and most managed clusters include it. Otherwise:
On kind or other local clusters with self-signed kubelet certificates, addkubectl apply -f https://github.com/kubernetes-sigs/metrics-server/releases/latest/download/components.yaml kubectl top nodes--kubelet-insecure-tlsto the metrics-server args (labs only). - CPU requests on the containers. The target is a percentage of the request, so without
resources.requests.cputhe HPA shows<unknown>. See requests and limits. - A workload that can run several replicas: stateless, with a
readinessProbe.
Create an HPA #
Use the Deployment of Pods and Deployments with requests.cpu: 50m, and remove spec.replicas from the manifest so applying it does not reset the count.
kubectl autoscale deployment web --cpu-percent=50 --min=2 --max=10
kubectl get hpa web
As YAML, with the autoscaling/v2 API (the stable one, it supports several metrics and behavior):
apiVersion: autoscaling/v2
kind: HorizontalPodAutoscaler
metadata:
  name: web
spec:
  scaleTargetRef:
    apiVersion: apps/v1
    kind: Deployment
    name: web
  minReplicas: 2
  maxReplicas: 10
  metrics:
    - type: Resource
      resource:
        name: cpu
        target:
          type: Utilization
          averageUtilization: 50
    - type: Resource
      resource:
        name: memory
        target:
          type: Utilization
          averageUtilization: 80
  behavior:
    scaleUp:
      stabilizationWindowSeconds: 0
      policies:
        - { type: Percent, value: 100, periodSeconds: 60 }   # at most double per minute
    scaleDown:
      stabilizationWindowSeconds: 300                         # default: wait 5 minutes
      policies:
        - { type: Pods, value: 1, periodSeconds: 60 }         # remove 1 pod per minute
With several metrics, the HPA calculates the replicas for each and uses the highest. Memory rarely goes down when load goes down (apps keep their heap), so memory-based scaling is only good for apps whose memory follows the load.
Test it with load #
kubectl expose deployment web --port=80      # if the Service does not exist yet
kubectl run load --rm -it --image=busybox:1.36 --restart=Never -- \
  sh -c 'while true; do wget -q -O- http://web >/dev/null; done'
In another terminal:
kubectl get hpa web -w
kubectl get pods -l app=web -w
TARGETS rises above 50%, REPLICAS grows. Stop the load and after the stabilization window (5 minutes) the replicas go back down. A busy-loop wget may not be enough to burn CPU in nginx; use a heavier app or a tool such as hey or k6.
Custom and external metrics #
CPU is a poor signal for queue consumers or request-driven apps. The HPA can use:
| Type | Example | Needs |
|---|---|---|
Resource |
CPU, memory | metrics-server |
Pods |
http_requests_per_second per pod |
A metrics adapter such as Prometheus Adapter, with Prometheus |
Object |
Requests per second of an Ingress | Same |
External |
Length of an SQS queue | An adapter, or KEDA, which creates and manages the HPA for you with many event sources |
For event-driven or scale-to-zero workloads, KEDA is usually easier than writing your own adapter.
Practical advice #
- Set
minReplicasto at least 2 for availability, and add aPodDisruptionBudget. - Leave headroom: a target of 50-70% CPU, not 90%, because new pods take time to start (image pull, startup probe).
- Make pods start fast and answer readiness quickly, or the HPA scales too late.
- The HPA and a hand-written
replicasfight: pick one. With Argo CD or Helm, omitreplicasor ignore the difference. - Pods that were just created or are not Ready are handled specially, so a slow start does not cause a scale-up spiral.
- Cap
maxReplicasto what the cluster and your budget (and the database behind the app) can bear.
Common errors #
| Symptom | Cause | Fix |
|---|---|---|
TARGETS shows <unknown>/50% |
metrics-server is missing or not ready, or the pods have no CPU request | kubectl top pods, add resources.requests.cpu, install metrics-server |
FailedGetResourceMetric ... failed to get cpu utilization: missing request for cpu in container web of Pod ... |
A container without a CPU request (a sidecar counts) | Add requests to every container, or use type: ContainerResource |
unable to get metrics for resource cpu: unable to fetch metrics from resource metrics API: the server is currently unable to handle the request |
metrics-server is down, or its APIService is unhealthy | kubectl get apiservice v1beta1.metrics.k8s.io, check its pod logs |
kubectl top says error: Metrics API not available |
metrics-server not installed | Install it |
metrics-server logs x509: cannot validate certificate for ... it doesn't contain any IP SANs |
Self-signed kubelet certs in local clusters | --kubelet-insecure-tls for labs, or sign the kubelet certs properly |
ScalingLimited: True with TooManyReplicas |
maxReplicas reached |
Raise it, optimize the app |
| HPA never scales down | Scale-down stabilization (5 min), memory metric high, or pods at the minReplicas |
kubectl describe hpa, wait, check the metric |
| Replicas jump back to the number in Git | replicas: in the manifest is re-applied |
Remove it from the manifest |
New pods Pending after scale-up |
The cluster is full | Add a cluster autoscaler or nodes, see Pending |
| Scale-up is too slow, users see errors | Slow startup, no headroom, high target | Lower the target, faster images, behavior.scaleUp |
the HPA was unable to compute the replica count: invalid metrics |
Wrong metric definition | Check the YAML, kubectl describe hpa |
| Flapping up and down | Short window, spiky metric | Increase scaleDown.stabilizationWindowSeconds, limit policies |
How to debug an HPA #
kubectl get hpa web -o wide
kubectl describe hpa web          # Conditions: AbleToScale, ScalingActive, ScalingLimited; Events
kubectl top pods -l app=web --containers
kubectl get --raw "/apis/metrics.k8s.io/v1beta1/namespaces/default/pods" | head -c 600
kubectl get apiservice v1beta1.metrics.k8s.io
kubectl -n kube-system logs deploy/metrics-server --tail=30
kubectl get deploy web -o jsonpath='{.spec.replicas}{"\n"}'
In describe hpa, read Conditions first: ScalingActive False with FailedGetResourceMetric is a metrics problem; AbleToScale and the events tell what it did (SuccessfulRescale, with the reason). See How to debug Kubernetes.
Frequently asked questions #
HPA, VPA or Cluster Autoscaler? HPA changes the number of pods. VPA changes the size (requests) of pods. Cluster Autoscaler or Karpenter changes the number of nodes. They work together: HPA creates pods, the cluster autoscaler adds nodes for the pods that are Pending.
Can I use HPA and VPA together? Not on the same CPU or memory metric. Use VPA in recommendation mode, or HPA on a custom metric.
How fast does it react? It checks every 15 seconds and by default scales up right away and scales down after 5 minutes of stable lower load.
Can it scale to zero? Not with the standard HPA (minReplicas is 1 or more). Use KEDA or Knative.
Does it work for StatefulSets? Yes (scaleTargetRef.kind: StatefulSet), if your application supports it.
What is a good CPU target? 50-70% for web apps. Lower for slow-starting ones.
Why Utilization and not AverageValue? Utilization is a percentage of the request. AverageValue is an absolute number (for example 200m), independent of the request.
Next steps #
Understand why pods fail to start under load with Pod stuck in Pending and CrashLoopBackOff, and monitor the result with Prometheus and Grafana.