

Kubernetes Probes and Resource Limits: Liveness, Readiness, Requests and OOMKilled
Two things that keep an app healthy #
Kubernetes restarts and routes traffic based on what you tell it about your container:
- Probes tell it whether the app is starting, alive and ready for traffic.
- Requests and limits tell it how much CPU and memory the app needs and may use.
Without them the scheduler guesses, a deadlocked app keeps receiving traffic and one noisy pod can starve the node. Most CrashLoopBackOff, OOMKilled and "502 during deploy" problems start here.
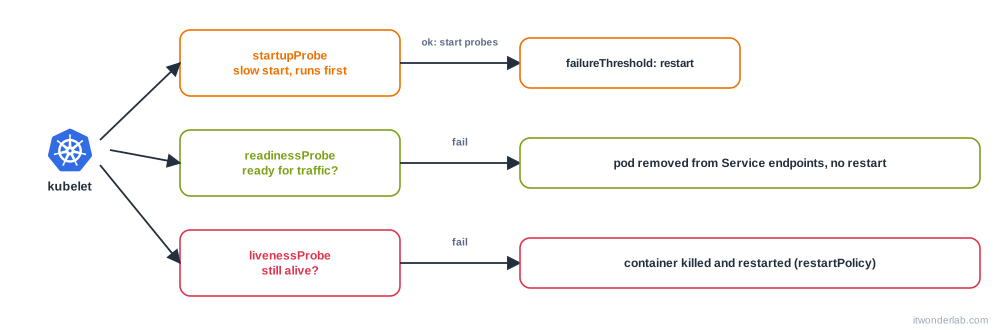
The three probes #
| Probe | Question | When it fails | Runs |
|---|---|---|---|
startupProbe |
Has the app finished starting? | The container is restarted | Until it succeeds once. Disables the other two meanwhile |
readinessProbe |
Can it receive traffic now? | The pod is removed from the Service endpoints. No restart | All the life of the container |
livenessProbe |
Is it stuck for good? | The container is killed and restarted | All the life of the container |
Mechanisms: httpGet (status 200-399), tcpSocket (port opens), exec (command exits 0) and grpc.
      containers:
        - name: api
          image: myapi:1.0
          ports:
            - containerPort: 8080
          startupProbe:
            httpGet: { path: /healthz, port: 8080 }
            periodSeconds: 5
            failureThreshold: 30       # up to 150 s to start
          readinessProbe:
            httpGet: { path: /ready, port: 8080 }
            periodSeconds: 10
            timeoutSeconds: 2
            failureThreshold: 3
          livenessProbe:
            httpGet: { path: /healthz, port: 8080 }
            periodSeconds: 20
            timeoutSeconds: 2
            failureThreshold: 3
The defaults: periodSeconds: 10, timeoutSeconds: 1, failureThreshold: 3, successThreshold: 1.
Rules that avoid outages #
- Liveness must not check dependencies. If the liveness endpoint calls the database and the database is down, every pod restarts at once and you turn a partial failure into a total one. Liveness answers only "is this process able to respond".
- Readiness may check dependencies the app cannot work without, but be careful: if all pods become unready, the Service has no endpoints.
- Use a
startupProbefor slow starts (Java, large caches) instead of a hugeinitialDelaySecondsin the liveness probe. - Do not use
execprobes that are heavy: they run every period in every pod. - Always define readiness for apps behind a Service: the rolling update of Deployments waits for it.
Requests and limits #
          resources:
            requests:
              cpu: 250m          # 0.25 core, used by the scheduler
              memory: 256Mi
            limits:
              memory: 512Mi      # exceeding it kills the container
# cpu limit omitted on purpose, see below| Request | Limit | |
|---|---|---|
| Used by | The scheduler to place the pod, and by the HPA to compute utilization | The kernel (cgroups) at runtime |
| CPU | A guaranteed share of CPU time | Throttling: the container is slowed down, not killed |
| Memory | Reserved on the node | OOMKilled: the container is killed (exit code 137) |
CPU is measured in cores: 1 = one vCPU, 500m = half. Memory in bytes: 256Mi, 1Gi (not 256M, which is decimal megabytes, and a lowercase m means millibytes, a common typo).
Quality of Service classes #
Kubernetes derives a QoS class and uses it to choose who dies first when the node runs out of memory:
| Class | Condition | Eviction order |
|---|---|---|
Guaranteed |
Every container has requests equal to limits for CPU and memory | Last |
Burstable |
At least one request or limit | Middle |
BestEffort |
No requests nor limits | First |
kubectl get pod <pod> -o jsonpath='{.status.qosClass}'How to choose values #
- Measure first:
kubectl top pod(needs metrics-server) and your monitoring with Prometheus and Grafana. - Memory: request near the normal usage, limit with a margin above the peak. Memory is not compressible, so be generous and set
request = limitfor important pods. - CPU: request near the average. Many teams set no CPU limit, to avoid throttling when the node has idle CPU, and rely on requests for fair sharing. If you use limits, watch the
container_cpu_cfs_throttled_periods_totalmetric. - A
LimitRangesets defaults per namespace and aResourceQuotacaps the total, which is a good practice for shared clusters (see Namespaces and RBAC). - Languages with a runtime need tuning to the limit: Java (
-XX:MaxRAMPercentage=75), Node.js (--max-old-space-size), Go (GOMEMLIMIT).
Common errors #
| Symptom | Cause | Fix |
|---|---|---|
Last State: Terminated Reason: OOMKilled Exit Code: 137 |
The container used more memory than its limit | Raise the limit, fix the leak, tune the runtime. See CrashLoopBackOff |
Exit code 137 without OOMKilled |
SIGKILL after the grace period, or the node ran out of memory |
Handle SIGTERM; check node MemoryPressure |
Pod Evicted, The node was low on resource: memory |
Node pressure, and the pod was BestEffort or over its request |
Set requests, add nodes |
Liveness probe failed: HTTP probe failed with statuscode: 500 / connection refused |
The endpoint fails or the app is not listening yet | Test it with curl inside the pod, add a startupProbe |
Liveness probe failed: Get "http://10.0.0.5:8080/healthz": context deadline exceeded |
The app is slow, the timeout is 1 s or the CPU is throttled | Raise timeoutSeconds, requests and limits |
Restarts every few minutes with Container web failed liveness probe, will be restarted |
The probe is too strict, or the app really hangs | Relax thresholds, read the logs before the restart (--previous) |
Readiness probe failed and the pod stays 0/1 |
Wrong path or port, wrong scheme (HTTPS), auth required | kubectl describe pod, test the same URL |
0/3 nodes are available: 3 Insufficient memory |
Requests are bigger than what any node has free | Lower the requests or add capacity, see Pending |
must be less than or equal to memory limit |
requests greater than limits |
Fix the values |
Invalid value: "256m" memory interpreted as 0.256 bytes |
Lowercase m |
Use Mi or Gi |
| Latency spikes with low CPU use | CPU throttling by the limit | Remove or raise the CPU limit |
forbidden: maximum cpu usage per Container is ... |
A LimitRange of the namespace |
kubectl describe limitrange |
How to debug probes and resources #
kubectl describe pod <pod>          # Events (Unhealthy), Last State, Restart Count, QoS Class, Limits
kubectl logs <pod> --previous       # output of the container before it was killed
kubectl top pod <pod> --containers
kubectl top node
kubectl get pod <pod> -o jsonpath='{.status.containerStatuses[0].lastState}'
kubectl exec <pod> -- wget -qO- http://localhost:8080/healthz     # run the probe by hand
kubectl describe node <node> | grep -A8 "Allocated resources"
kubectl get events --field-selector involvedObject.name=<pod>
In describe pod, look at Last State: Terminated (reason and exit code), Restart Count and the Events list: Unhealthy events show which probe failed and the message. Use the troubleshooting flow for the next steps.
Frequently asked questions #
Liveness or readiness? Readiness controls traffic, liveness controls restarts. Start with readiness. Add liveness only if your app can deadlock and recover with a restart.
What does exit code 137 mean? The process received SIGKILL (128 + 9). Most often the OOM killer, but it also happens when the app ignores SIGTERM for longer than terminationGracePeriodSeconds.
Should I set CPU limits? It is debated. Memory limits: yes. CPU limits cause throttling even with idle CPU, so many teams skip them and set accurate requests. Keep them if you need hard isolation or a Guaranteed QoS class.
What happens if I set no requests? The scheduler assumes zero, so it can overload a node, the pod is BestEffort and the HPA cannot compute utilization.
How long should the startup time be? failureThreshold × periodSeconds of the startup probe must be longer than the slowest real start, plus a margin.
Can I probe a job or a worker with no port? Yes, with an exec probe, for example checking a heartbeat file the app touches.
Does kubectl top show requests? No, it shows current usage. Requests are in kubectl describe node and describe pod.
Next steps #
Let the cluster scale on these numbers with the Horizontal Pod Autoscaler and learn the failures with CrashLoopBackOff.