

How to Debug Kubernetes: kubectl logs, describe, events, exec and debug
A method, not a list of commands #
Almost every Kubernetes problem is solved by the same loop: look at the status, read the events, read the logs, test from inside, change one thing. This tutorial gives that loop and the commands of kubectl for each step. Then each frequent failure has its own guide: CrashLoopBackOff, ImagePullBackOff and Pending.
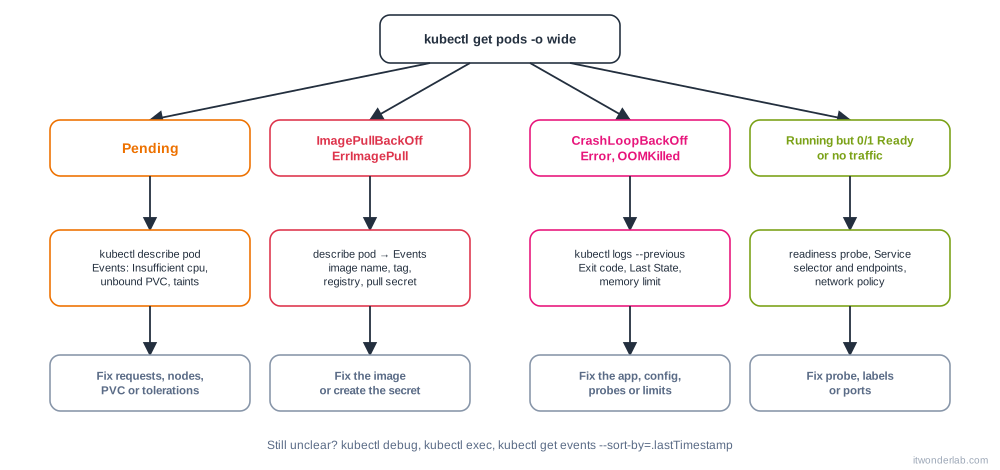
Step 1: what is the status #
kubectl get pods -o wide                     # status, restarts, node, IP
kubectl get pods -A | grep -v -E "Running|Completed"      # everything that is not healthy
kubectl get deploy,rs,svc,ingress,pvc
kubectl get nodes
How to read the STATUS and READY columns:
| Status | Meaning | Guide |
|---|---|---|
Pending |
Accepted but not running: not scheduled, or waiting for volumes or the image | Pending |
ContainerCreating |
Scheduled; the image is being pulled, or volumes and secrets are being mounted | describe pod events |
ImagePullBackOff, ErrImagePull |
The image cannot be pulled | ImagePullBackOff |
CrashLoopBackOff |
The container starts and exits again and again | CrashLoopBackOff |
CreateContainerConfigError |
A missing ConfigMap, Secret or key | ConfigMaps and Secrets |
Error, OOMKilled |
The container exited with an error or was killed for memory | Probes and limits |
Running with 0/1 ready |
The readiness probe fails | Probes |
Terminating for long |
A finalizer, a stuck volume or a process that ignores SIGTERM | kubectl describe pod, kubectl delete pod --grace-period=0 --force as a last resort |
Evicted |
The node ran out of memory or disk | kubectl describe pod, describe node |
Completed |
A Job or one-shot container finished successfully | Normal |
Step 2: describe and events #
kubectl describe is the most useful command of the list. Read it from the bottom: the Events section.
kubectl describe pod <pod>
kubectl get events --sort-by=.lastTimestamp
kubectl get events -A --field-selector type=Warning --sort-by=.lastTimestamp
kubectl get events --field-selector involvedObject.name=<pod>
kubectl get events -w                       # follow in real time
What to look at in describe pod:
- Events:
FailedScheduling,Failed to pull image,FailedMount,Unhealthy(a probe),BackOff,Killing. - State / Last State:
Waiting(Reason),Terminated(Reason, Exit Code, started and finished times). - Restart Count, Ready, Conditions (
PodScheduled,Initialized,ContainersReady,Ready). - Node, IP, QoS Class, Limits and Requests, Tolerations, Volumes.
Events are kept for about one hour, so look soon after the failure.
Step 3: logs #
kubectl logs <pod>
kubectl logs <pod> -c <container>           # pods with more than one container
kubectl logs <pod> --previous               # the container that crashed, not the new one
kubectl logs <pod> --all-containers --prefix --timestamps
kubectl logs -f <pod> --tail=100 --since=10m
kubectl logs deploy/web                      # one pod of the Deployment
kubectl logs -l app=web --all-containers --max-log-requests=10 --tail=20
kubectl logs <pod> -c <init-container>       # init containers run first
--previous is the one that people forget: after a restart, plain kubectl logs shows the new, usually empty, container. For many pods use a tool such as stern (stern web). For logs after a pod is deleted you need a log collector (Loki, CloudWatch, Elastic).
Exit codes in describe pod:
| Code | Meaning |
|---|---|
0 |
Success |
1 |
Application error |
2 |
Misuse of a shell command |
126, 127 |
Command not executable or not found (wrong command, missing binary) |
137 |
SIGKILL: OOM killer or the grace period expired |
139 |
Segmentation fault |
143 |
SIGTERM: stopped normally |
Step 4: look inside #
kubectl exec -it <pod> -- sh                         # bash, if the image has it
kubectl exec <pod> -- env
kubectl exec <pod> -- cat /etc/resolv.conf
kubectl exec <pod> -c <container> -- ls -l /data
kubectl port-forward pod/<pod> 8080:80               # test the pod from your computer
kubectl port-forward svc/web 8080:80
kubectl cp <pod>:/var/log/app.log ./app.log
kubectl get pod <pod> -o yaml                        # what Kubernetes actually has
kubectl get -o yaml shows the status and the final spec after defaults and admission (including injected sidecars), which can differ from your file.
Ephemeral containers: kubectl debug #
Minimal images (distroless, scratch) have no shell, and a crashing pod cannot be exec'd. kubectl debug adds a temporary container with your tools:
kubectl debug -it <pod> --image=busybox:1.36 --target=<container>     # shares the process namespace
kubectl debug -it <pod> --image=nicolaka/netshoot --target=<container>   # network tools
kubectl debug <pod> -it --copy-to=<pod>-debug --container=<container> -- sh   # a copy of the pod with another command
kubectl debug <pod> -it --copy-to=<pod>-debug --set-image=*=ubuntu:24.04      # a copy with another image
kubectl debug node/<node> -it --image=ubuntu:24.04                            # a shell on a node (host fs in /host)
The --copy-to forms are the way to debug a CrashLoopBackOff: the copy starts a shell instead of the failing command, so you can run that command by hand and see the error. Delete the copy afterwards. Ephemeral containers are not removed from the pod until it is deleted.
Step 5: test from the network's point of view #
kubectl run tmp --rm -it --image=curlimages/curl --restart=Never -- curl -sv http://web.default.svc:80
kubectl run tmp --rm -it --image=busybox:1.36 --restart=Never -- nslookup web
kubectl get endpoints web
kubectl get pods --show-labels
kubectl get networkpolicy -A
Go from the inside out: the pod answers on localhost, then on its pod IP, then through the Service, then through the Ingress, then from outside. The first layer that fails is the problem. Details in Services and Ingress.
Step 6: resources and nodes #
kubectl top pod --containers
kubectl top node
kubectl describe node <node>          # Conditions, Taints, Allocated resources, Events
kubectl get nodes -o wide
kubectl cordon <node>                 # stop scheduling to it
kubectl drain <node> --ignore-daemonsets --delete-emptydir-data
On the node (SSH): systemctl status kubelet, journalctl -u kubelet -n 100 --no-pager, crictl ps -a, crictl logs <id>, df -h, free -m. The cluster itself is covered in Kubernetes architecture.
Useful one-liners #
# Pods that restarted, sorted
kubectl get pods -A --sort-by='.status.containerStatuses[0].restartCount'
# Why was the last container terminated
kubectl get pod <pod> -o jsonpath='{.status.containerStatuses[*].lastState.terminated}{"\n"}'
# Images in use
kubectl get pods -A -o jsonpath='{range .items[*]}{.metadata.namespace}/{.metadata.name}: {.spec.containers[*].image}{"\n"}{end}'
# Everything about an app
kubectl get all -l app=web
# Is the API able to do it?
kubectl auth can-i create deployments -n dev
# Compare local manifest with the cluster
kubectl diff -f web.yaml
# Validate before applying
kubectl apply --dry-run=server -f web.yaml
The jq cheat sheet has many more for JSON output.
Common mistakes when debugging #
- Looking at
kubectl logsof the new container after a crash: add--previous. - Forgetting the namespace (
-n) and concluding "it does not exist". - Debugging the Service when the pod is not
Ready: check endpoints first. - Changing several things at once. Change one, re-test.
- Editing a pod by hand: it is replaced by the controller. Edit the Deployment.
- Reading the YAML you wrote instead of
kubectl get -o yaml, which is what runs. - Ignoring
Warningevents, which almost always contain the answer. - Using
kubectl delete podas a fix without finding the cause. It hides the problem until the next time.
Frequently asked questions #
Where are the Kubernetes logs? Container logs: kubectl logs. On the node, in /var/log/pods and /var/log/containers. Control plane components in kubeadm are static pods in kube-system. The kubelet logs go to the journal: journalctl -u kubelet.
How do I get a shell in a pod with no shell? kubectl debug -it <pod> --image=busybox --target=<container>.
How can I see the logs of a pod that was deleted? You cannot with kubectl. Ship logs to a central system (Loki, Elasticsearch, CloudWatch).
What does "no events" mean? Events expire after an hour, or the problem is inside the container, not in Kubernetes: read its logs.
Why does kubectl exec fail with OCI runtime exec failed: ... executable file not found? The image has no sh or bash. Use kubectl debug.
How do I increase kubectl's verbosity? kubectl get pods -v=6 shows the API calls and -v=8 the bodies. Useful for auth and connection issues.
How do I debug a Job? kubectl describe job <job> and kubectl logs job/<job>. A failed Job leaves its pods so you can read their logs, unless ttlSecondsAfterFinished removed them.
Next steps #
Work through the three most common failures: CrashLoopBackOff, ImagePullBackOff and Pending. Keep the kubectl cheat sheet at hand and install the Kubernetes Dashboard if you prefer a UI.